


Datadog is an amazing tool for service monitoring. However, quality comes with a cost. Datadog can become very expensive. Some have paid as much as 65 million dollars per year for it! Others have abandoned it, concluding that the Datadog service is simply not worth its price.
Is paying a lot the only option if you want to use Datadog? That was the question we asked ourselves while working on a project for one of our clients operating in the e-commerce industry, which generates 14 million visits per month. Datadog accounted for 20% of its infrastructure costs. This felt like too much for a service that was supposed to simply help us monitor things.
However, we were reluctant to leave Datadog. It has been doing an excellent job in helping us develop and maintain the project. The user interfaces for browsing and creating logs, metrics, and monitors in Datadog provided such a great user experience that we were hesitant to move on from it.
So we started to dig. Were there any "tricks" to reduce Datadog plan usage while still reaping its benefits?
The answer is yes. After some discovery work, we’ve found a way to reduce the Datadog budget by as much as 40%. If you are wondering how we achieved this, read on.
7 steps for reducing Datadog budget
1. Determine what to focus on
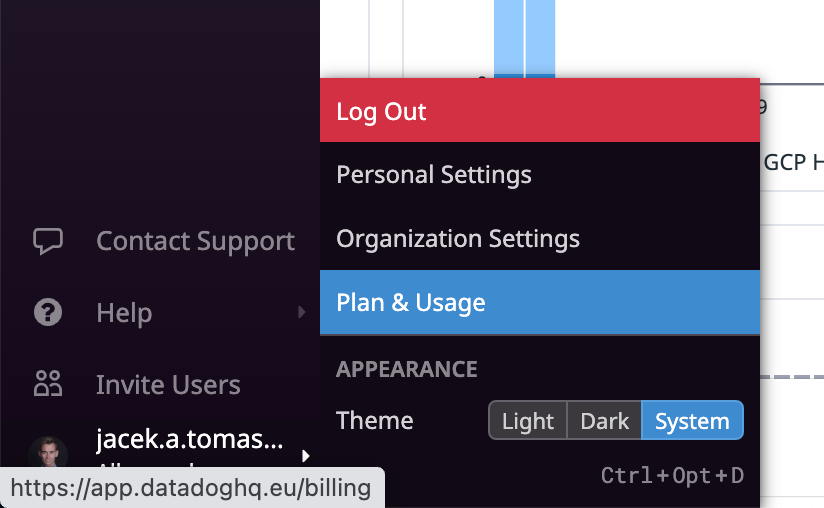
First, review your current expenses. Ensure you can access the "Plan & Usage" panel in the Datadog UI. (If not, request permission from your organization's administrators.)
Then, to see where you can reduce spending, use the divide and conquer approach by breaking down the problem into specific steps. For example, if you're currently spending money on logs, metrics, and API tests, you can split the problem into three parts: identify the specific logs you're spending money on, determine the metrics that consume the most resources, and analyze the API tests to see where costs can be reduced.
Discovering how the billing is split between each functionality will vary, as will the methods for reducing costs. In the next two steps, I will focus on two functions that are typically the most expensive: logs and metrics.
2. Reduce custom metrics
Any metric that you submit on your own (i.e., not through a built-in Datadog integration) will count towards your custom metrics quota.
Before optimizing anything, it is important to understand how Datadog counts custom metrics by reading their documentation. In short, it's not like logs, where the more metrics your application pushes, the more you'll have to pay. Rather, the number of unique combinations of metric names and tags count towards the billing.
For example, if you have a metric with no tags that counts the number of requests made to your server, Datadog will charge you for one metric, even if millions of requests are pushing data to that metric. However, if you start adding tags to the metric with random or user-generated values, such as IP addresses, each different IP address will be counted as a separate metric.
Repeating the "mistake" of having a tag with user-dependent values multiple times can quickly result in having to pay for thousands of custom metrics.
Fortunately, you can easily check whether you're already making this mistake by reviewing the usage of individual metrics. Go to the "Plan & Usage → Usage → Custom Metrics" view.
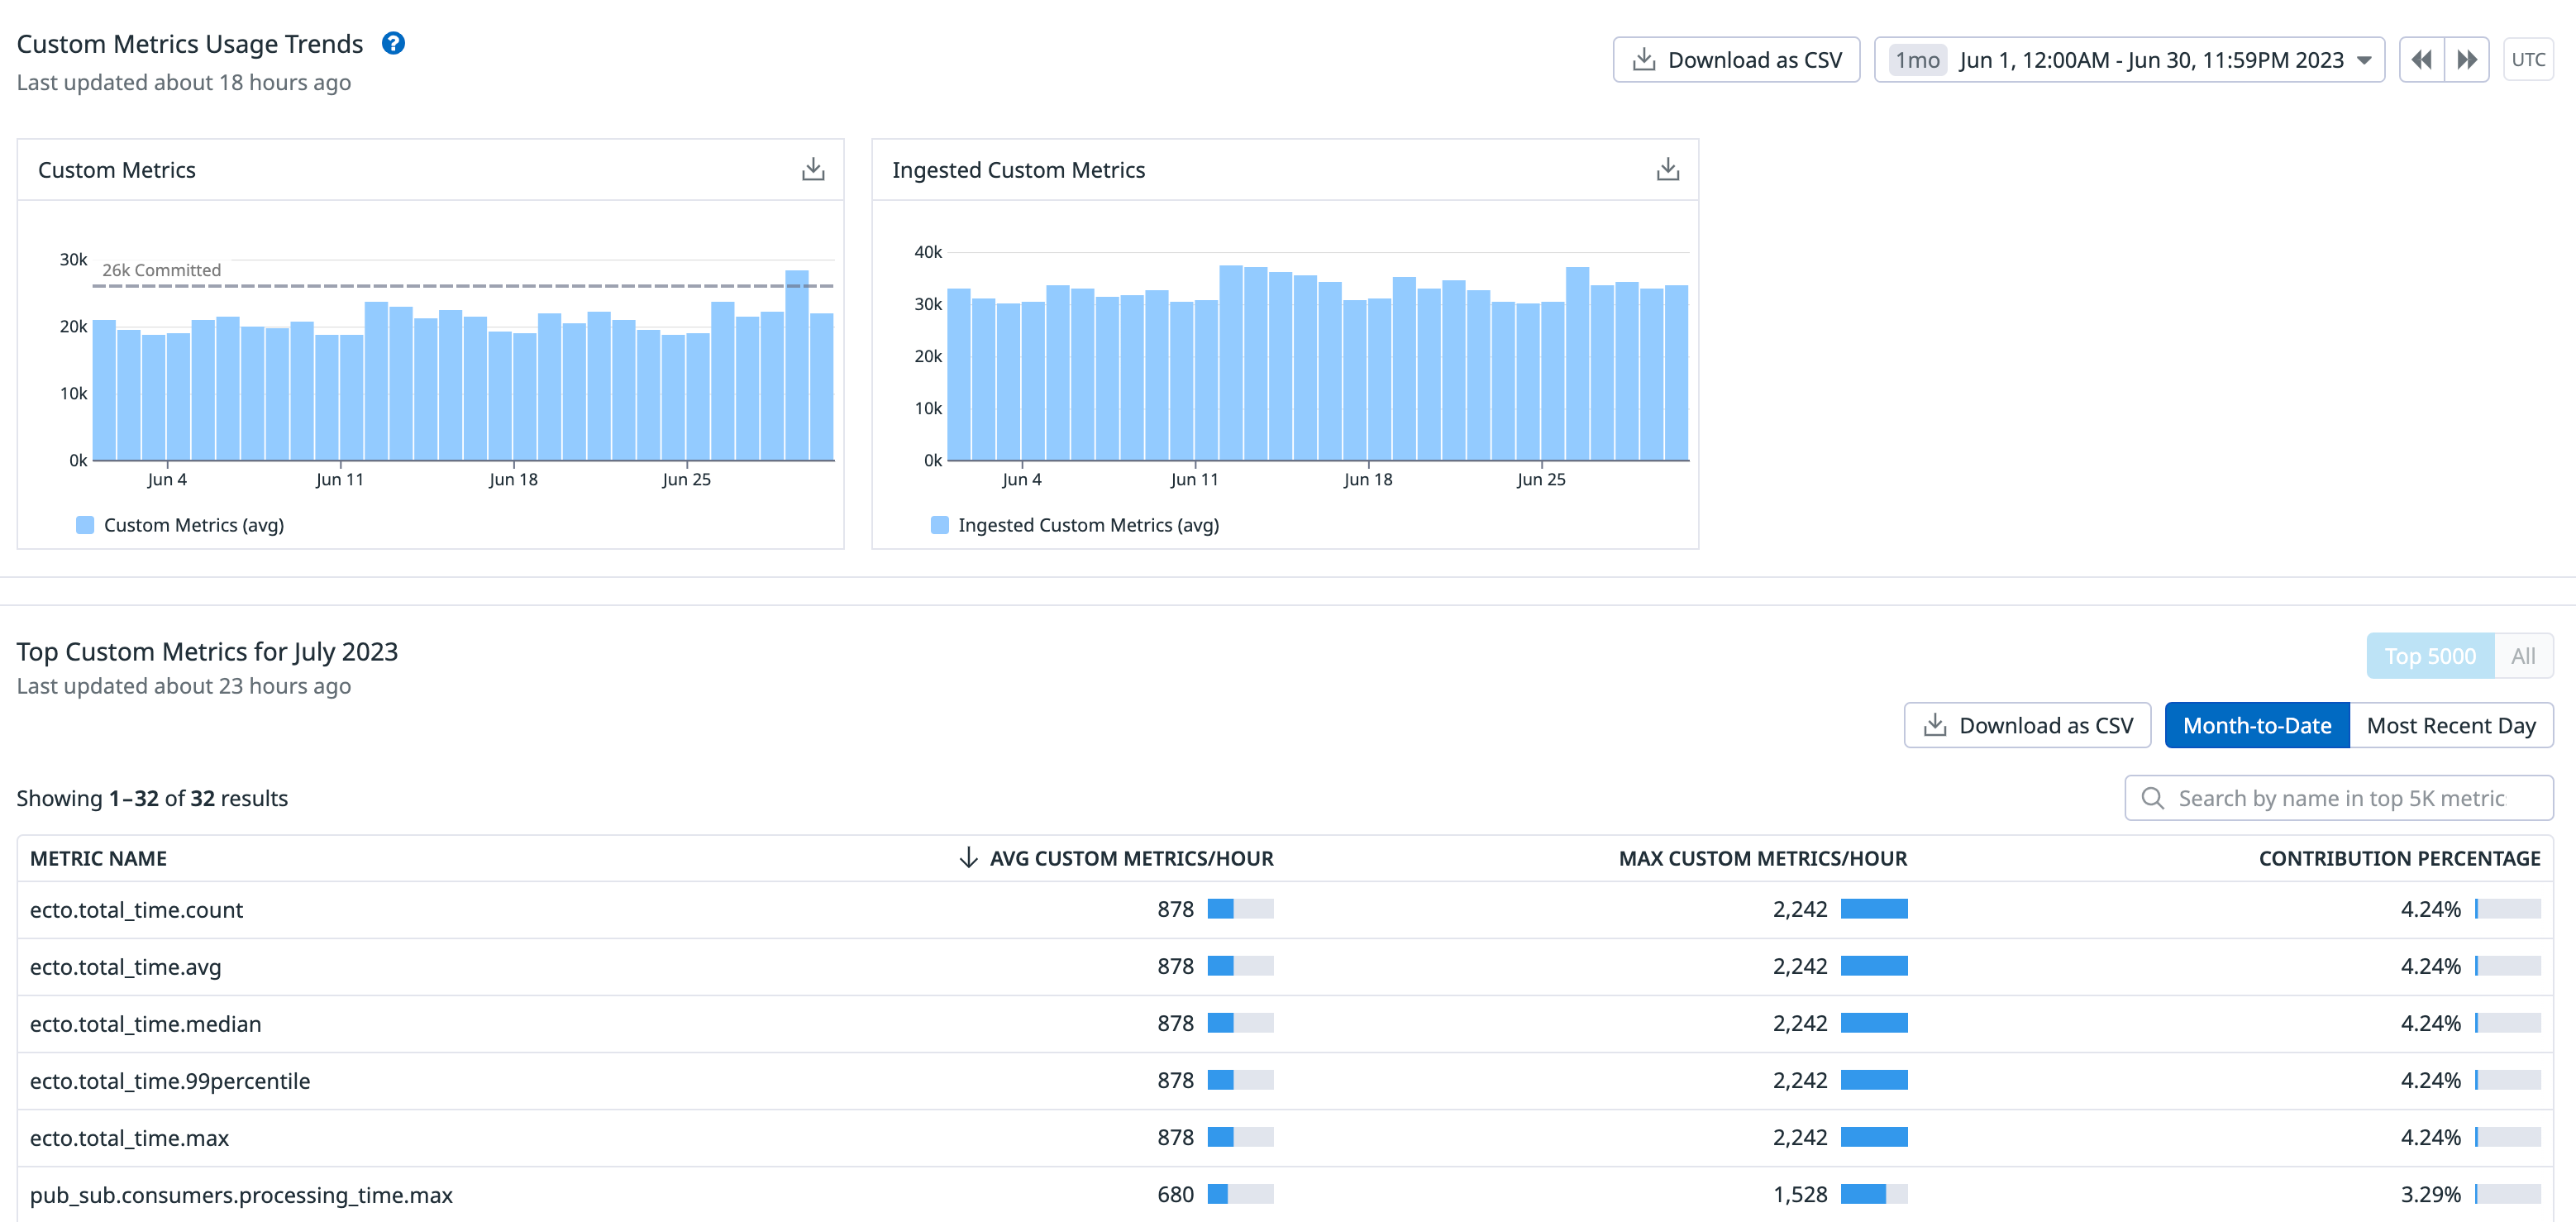
Take a moment to review whether any of the metrics appear to have unnecessarily large numbers. To view tag combinations for a particular metric, hover your mouse over it and click the "See in Metrics Summary" button.
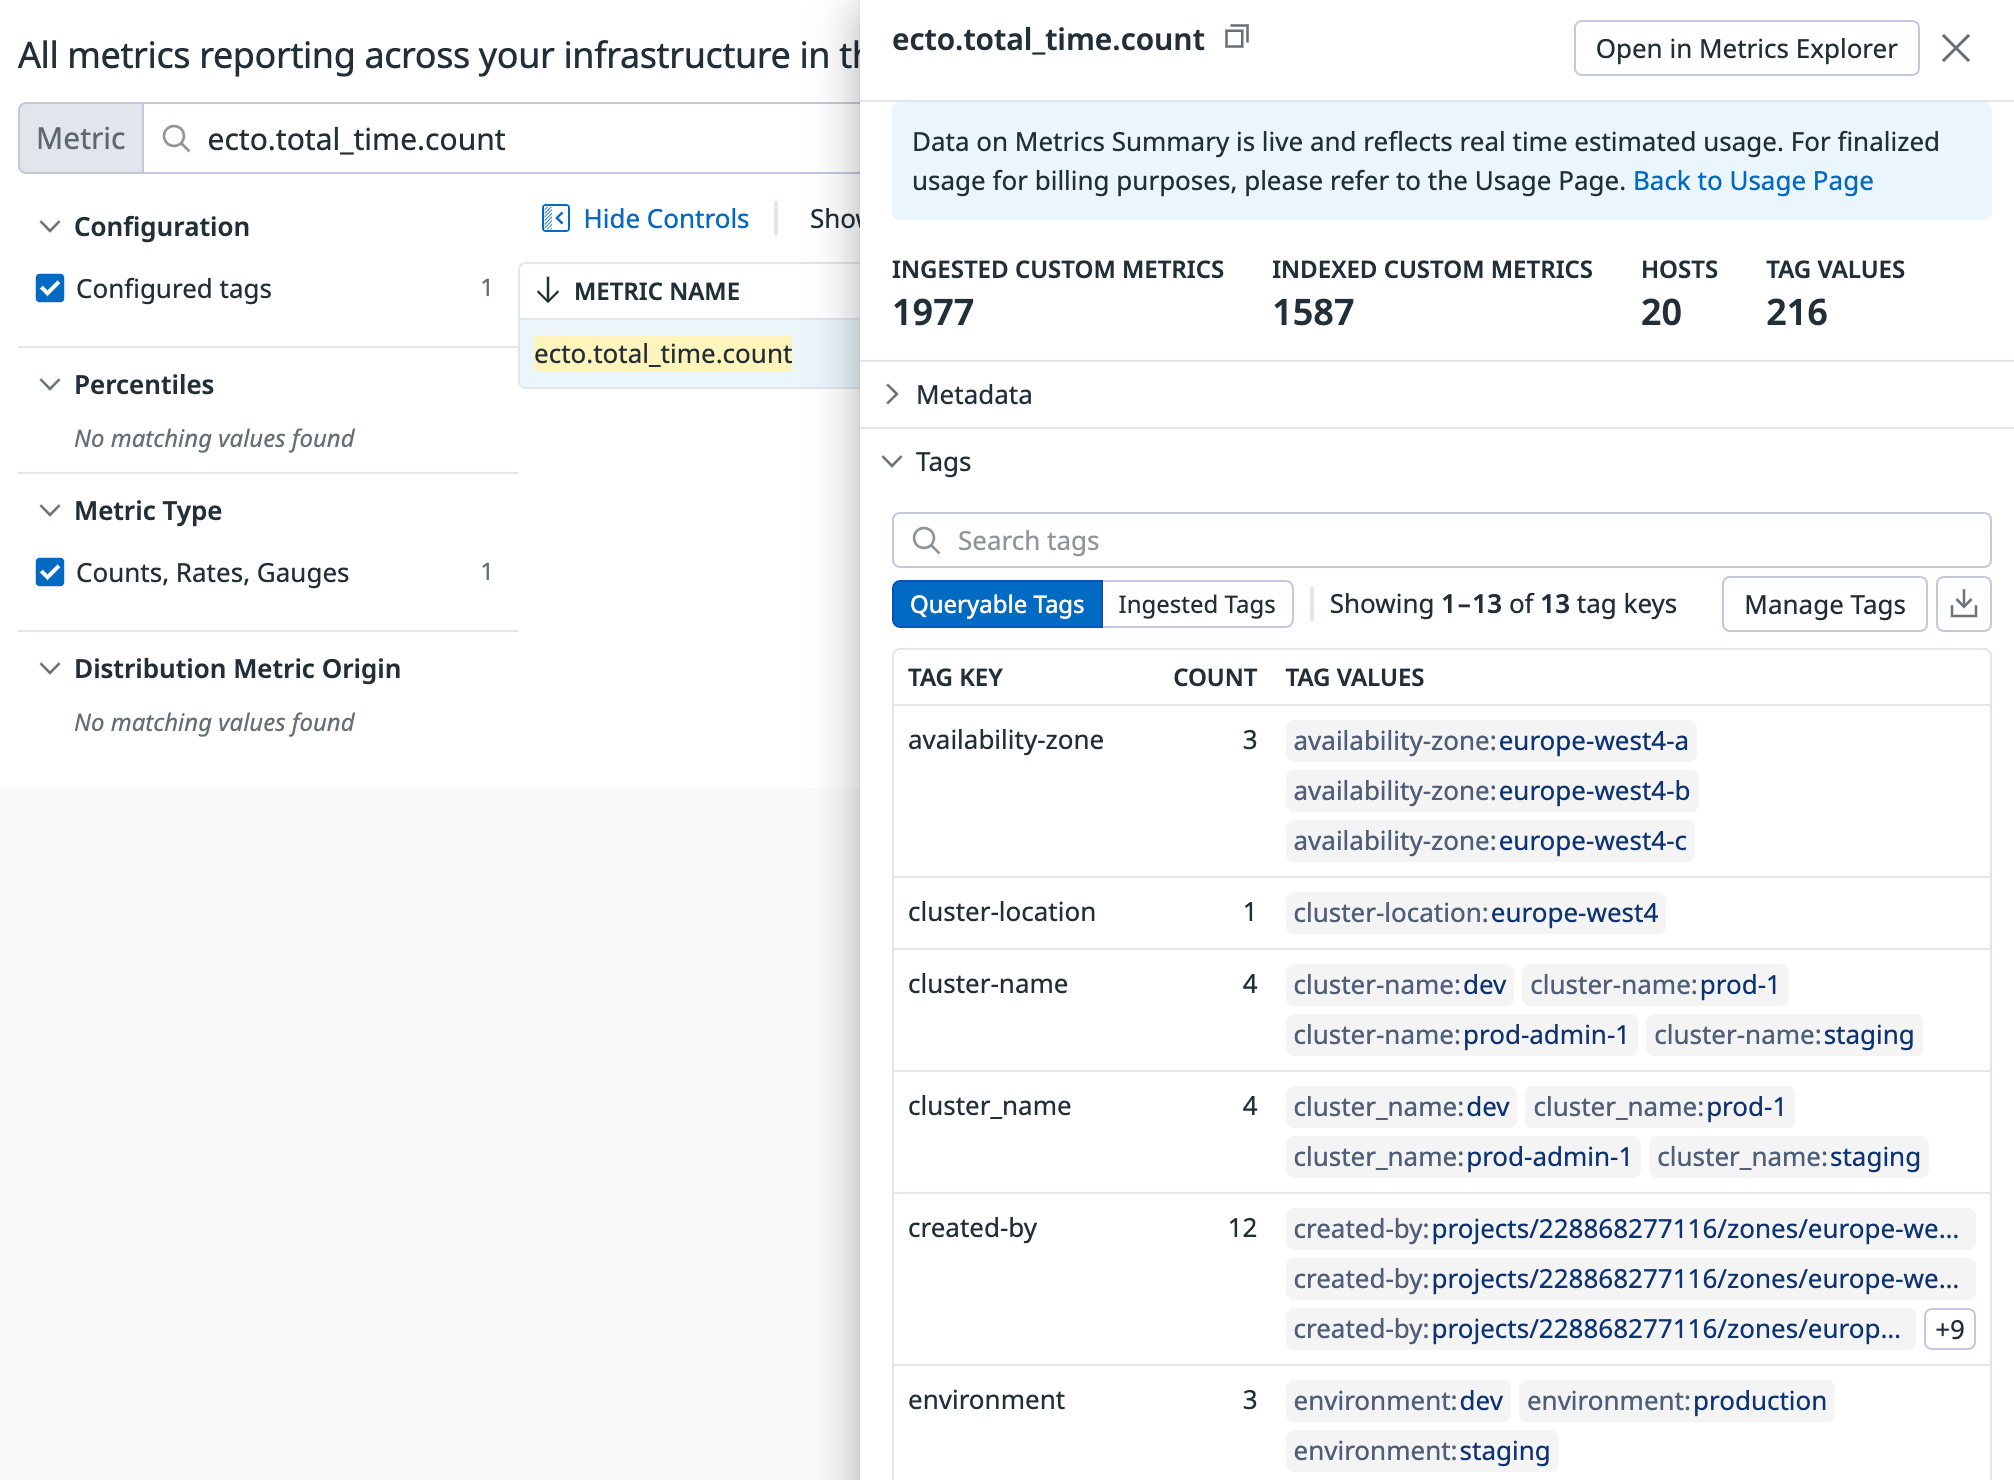
For instance, we discovered that we were tracking database query times using four distinct metrics (ecto.idle_time, ecto.query_time, ecto.queue_time, and ecto.decode_time). After consulting with all the developers on the project, it quickly became evident that the only metric we're interested in is the total time of a query. As a result, we dropped the four separate metrics in favor of just one: a single ecto.total_time metric.
In addition to removing some metrics entirely, you may want to remove certain tags from them in order to reduce the total number of unique tag value combinations. Fortunately, there's no need to modify any code to apply this change. Instead, open the details of any custom metric in the Metrics Summary view and click the "Manage Tags" button. From there, you can quickly visualize and make changes to the indexed tags of the selected metric.
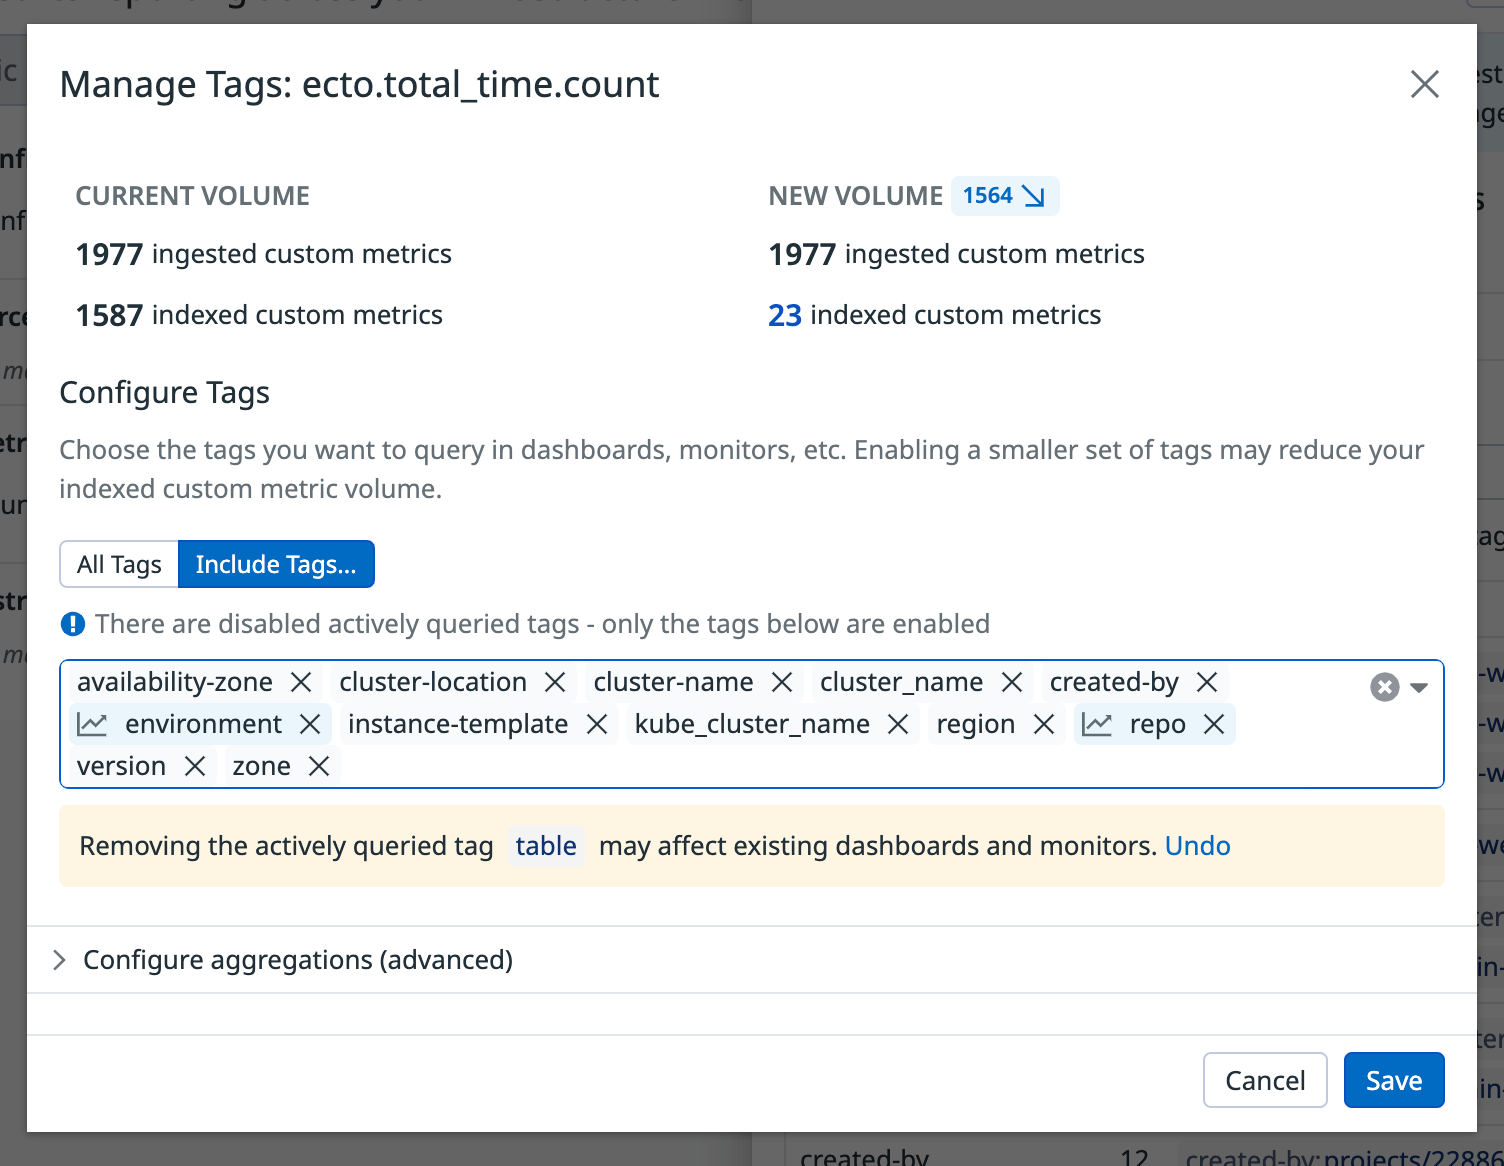
What we've done here is quickly iterate over our custom metrics with the largest number and dropped some of their irrelevant tags. This allowed us to reduce our usage of custom metrics by half, saving us about 12,000 USD annually. And the best part? It only took us a few minutes to make this optimization, all through a web browser.
3. Reduce ingested logs
Logs account for 40% of our Datadog budget and they probably account for a significant portion of your budget as well. While logs are necessary, it's important to investigate which ones are truly needed.
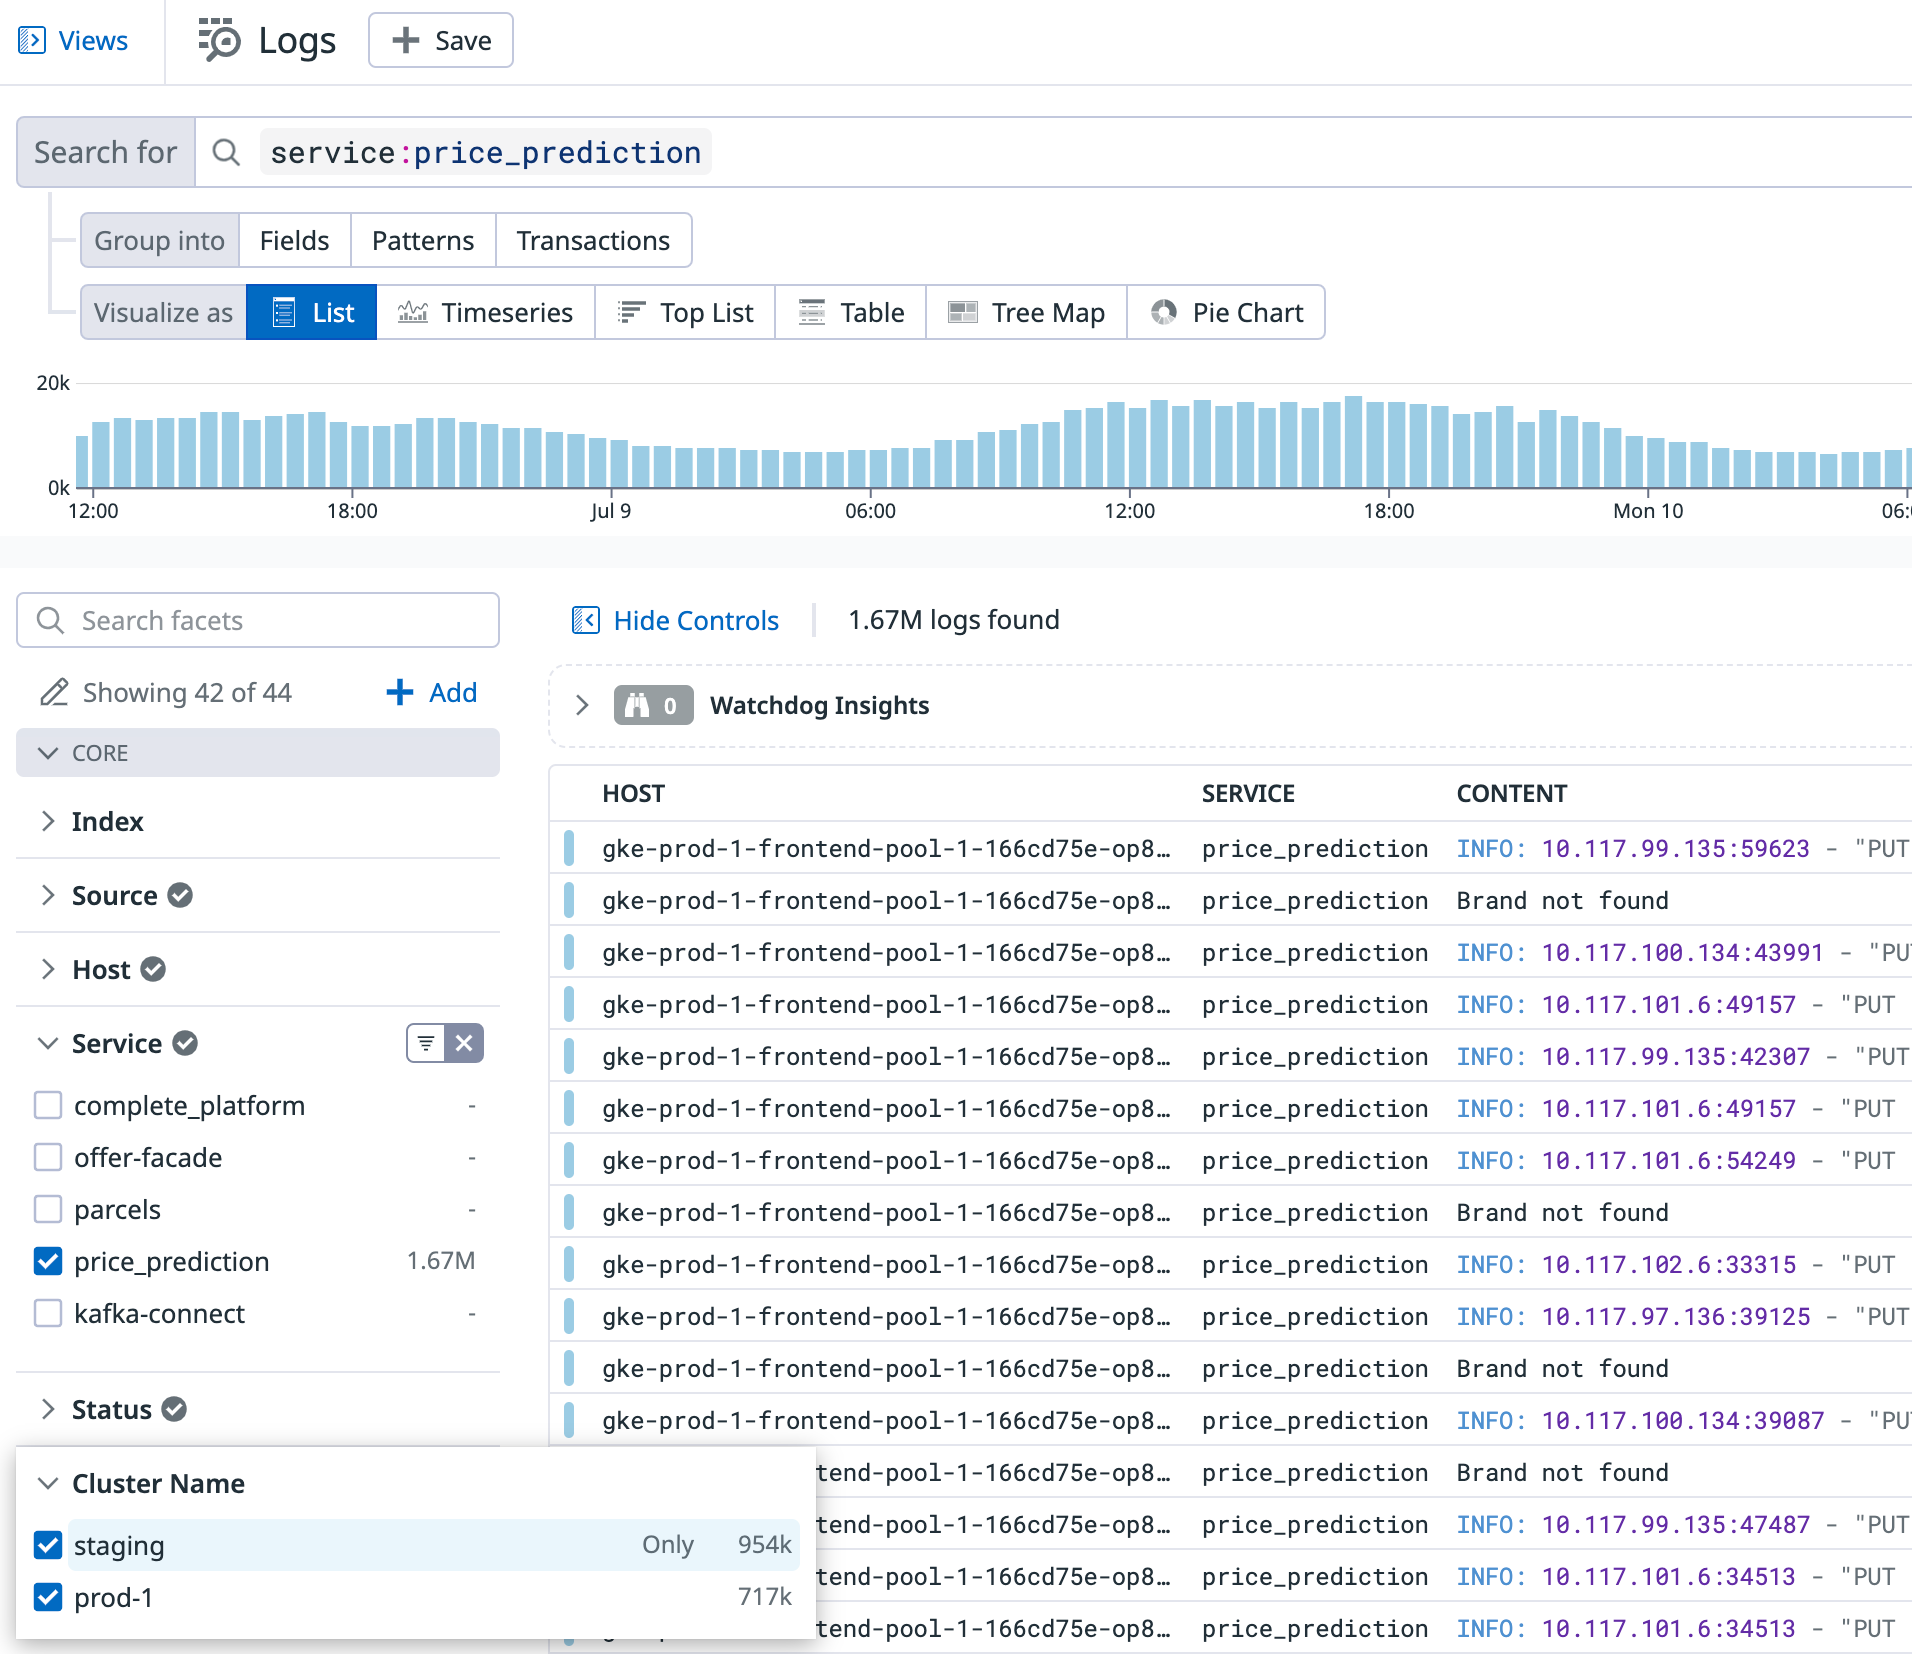
Take an hour or two to review the logs you're currently ingesting. Group them by service, environment, tags, and patterns (e.g., request log, database query log, custom log) to see how many of each type you have. You may find that some logs are produced in large numbers but are not actually needed.
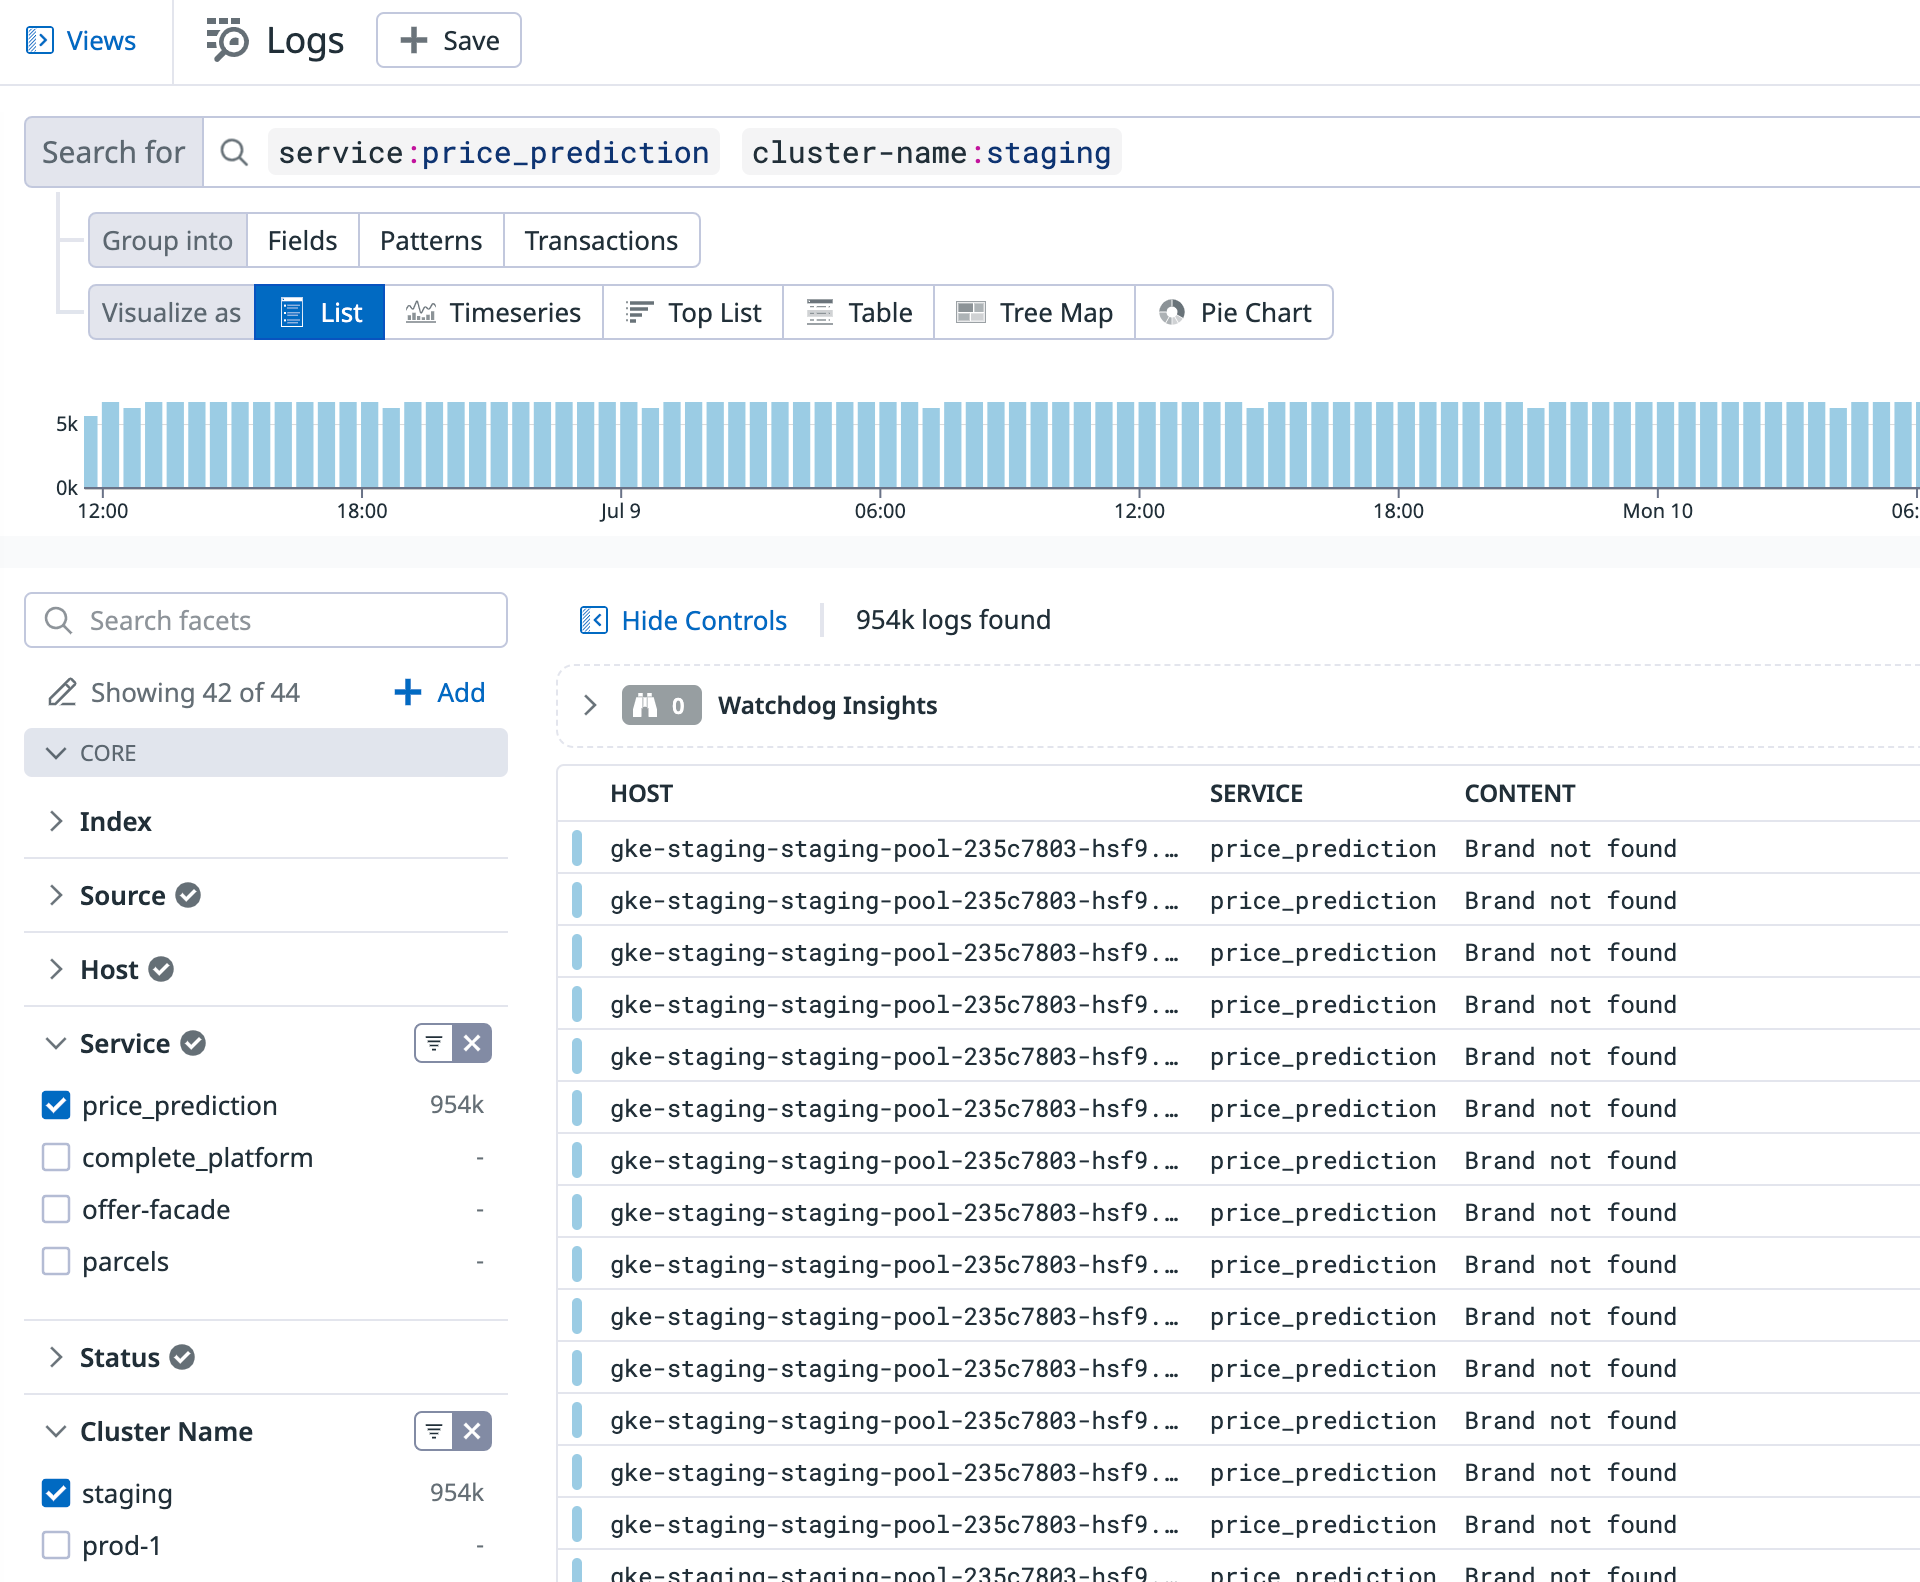
For example, we discovered that one of our microservices produced more logs on the staging environment than on production, even though it received 1000x less traffic there.
Upon inspecting it more closely it quickly became apparent: the service would repeatedly print a useless log 'Brand not found'.
Another example of unnecessary log entries we found were health checks. Each service we managed had its own health checks on every environment, which resulted in a significant amount of logs. After some consideration, we decided that these logs were unnecessary and disabled them by modifying the services code. Health check logs were then disabled by default unless a specific environment variable (e.g. DEBUG=1) was present. This allowed us to still generate them if needed, such as when debugging connectivity issues.
Another thing we noticed was that our infrastructure had several logs from third-party services, such as the Datadog agent or the Kubernetes Ingress controller for GCP (ingress-gce), that we were not interested in (at least when we knew there were no problems with them). To disable log collection for certain Kubernetes namespaces, we customized this through an environment variable of our Datadog agent. For example, we used DD_CONTAINER_EXCLUDE_LOGS="kube_namespace:kube-system kube_namespace:datadog". More docs on this here.
When deciding which logs to modify, it's important not to be too selective. To determine which logs to cut, calculate the average cost of log entries. For instance, let's assume you're interested in cutting any logs that cost more than 50 USD per month, which corresponds to more than 50 million log entries per month, according to billing. If that's the case, divide it by 30 days * 24 hours to determine that you should only be looking at logs that appear more than 70,000 times per hour. Therefore, you shouldn't worry too much about cutting logs that appear less frequently than that, especially if it's a burden for your developers to do so.
4. Don’t use synthetic monitoring (if unneeded)
During the process of drafting the new budget for Datadog with our client, we noticed that they had been paying $840 annually for Synthetic API Tests. Upon closer inspection, it was revealed that the test was simply to verify whether their project homepage was online (i.e., whether requesting it returned an HTTP 200 status code).
However, we already had similar tests, which were much better, enabled elsewhere. With our current monitors, we would have been notified of any potential issues before the homepage even went down. These monitors would notify us when a certain percentage of requests started to fail or when the number of requests to our page suddenly dropped to an unexpectedly low level.
As such, there was simply no need to pay $840 annually to verify something that we already had verified. The solution was simple: delete the test.
Try doing the same. Ask yourself if there are any Datadog features that you are currently paying for, but don't really need? Perhaps there are other simple ways to achieve the same functionality without the need to pay extra to Datadog. Of course, remember to not to be too selective in this process. Spending hours just to save a few dollars per month on Datadog is not a good use of your time either.
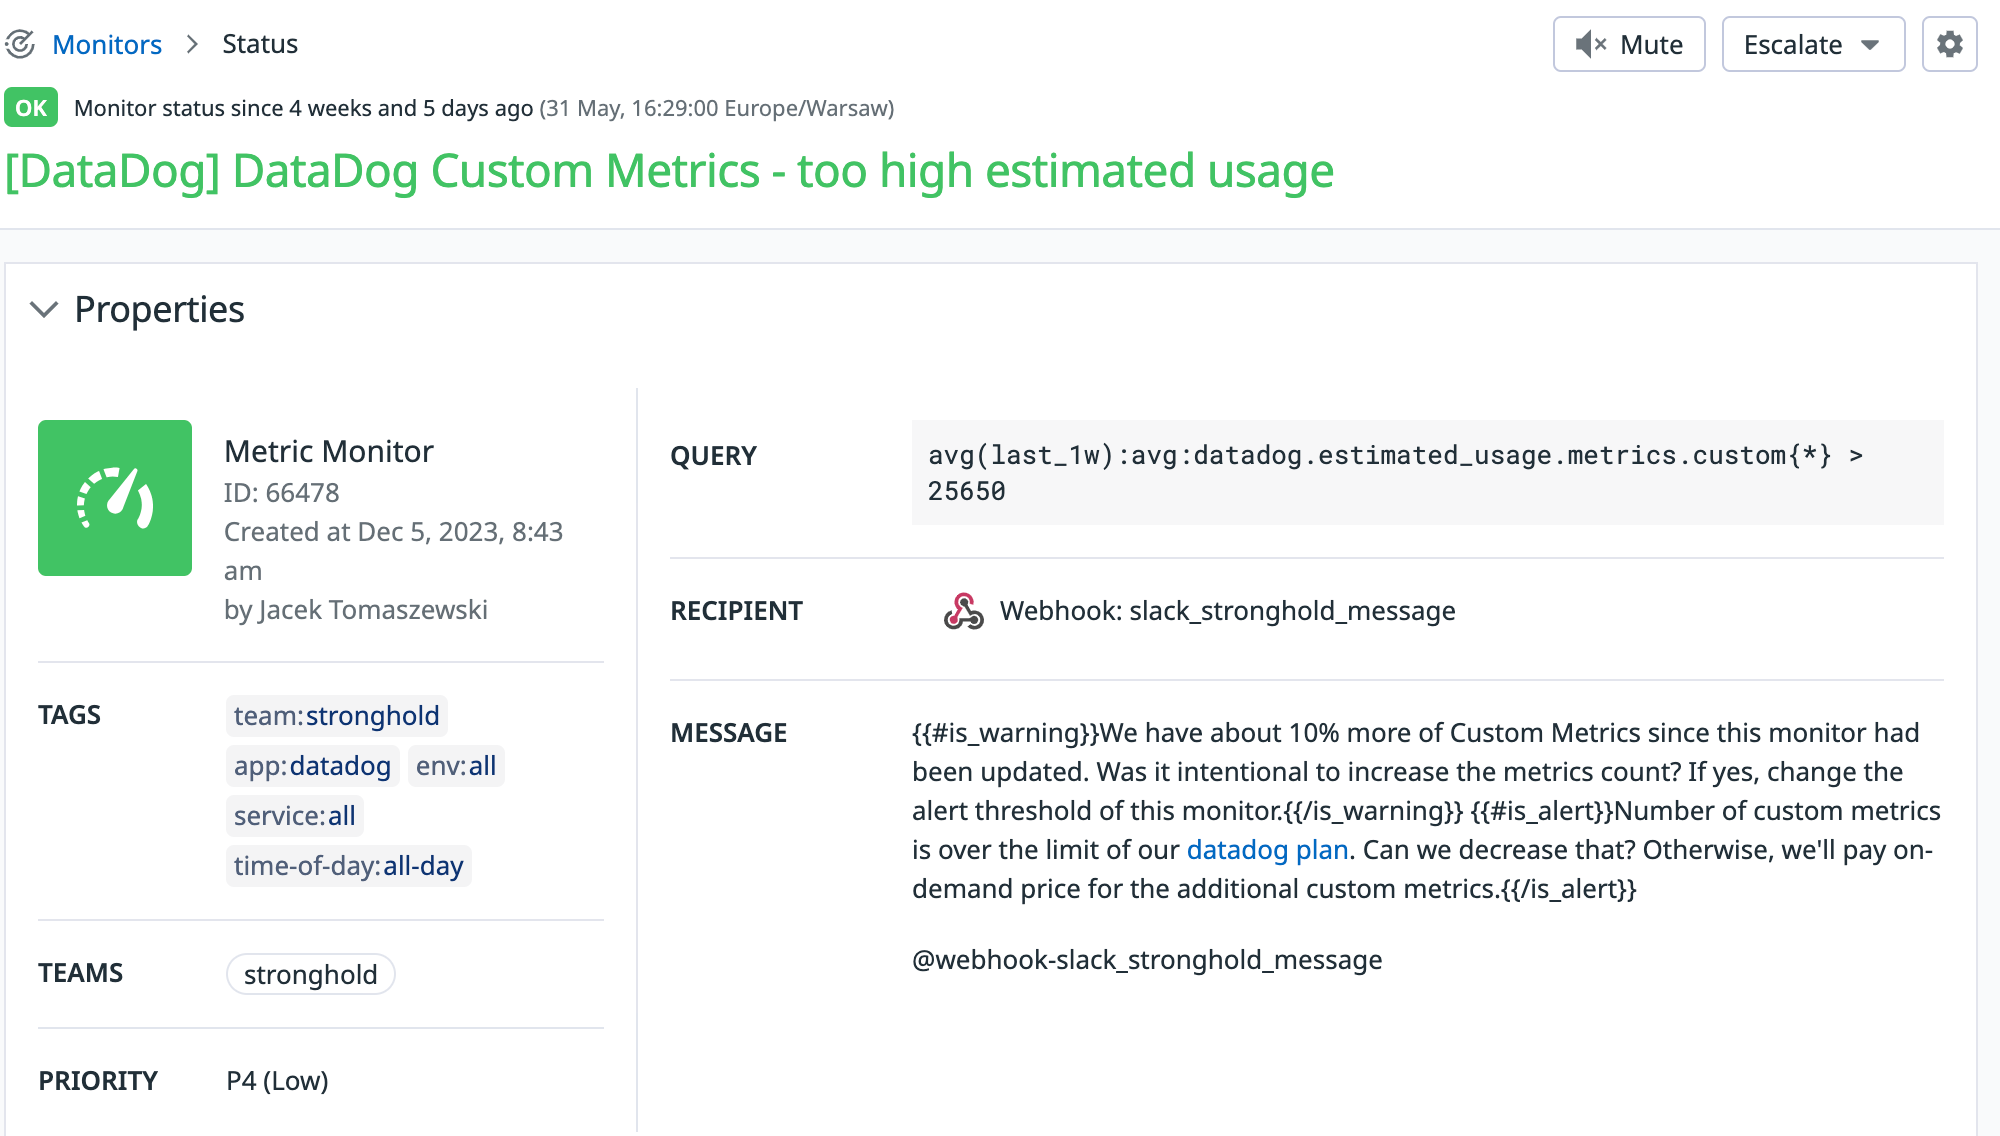
5. Set up monitors for Datadog plan usage
After correcting your usage of Datadog, make sure to avoid mistakenly using it again. Set a reminder to review it once a month or so, or set up monitors that will alert you if your Datadog usage exceeds your expected limits.
For example, our team responsible for monitoring tools now receives Slack notifications when their usage surpasses expected levels. Upon receiving such notifications, they investigate the issue, and if needed, assign the task of fixing it to the team responsible for the cause.
6. Don’t commit to your max estimated usage on yearly contract
Last but not least, if you are negotiating a new contract with Datadog while on a yearly plan, avoid committing to too big of numbers. We made the mistake of overcommitting once, thinking it would be cheaper and easier for invoicing and budgeting reasons. We tried calculating our Datadog usage one year in advance and committed to that amount.
However, circumstances regarding the project have changed, and some of the budget remained unused. In hindsight, we think that the price difference between committed and on-demand services was too small to justify overcommitment. Therefore, we will probably not repeat that approach again. Instead, we will only commit to what we are certain of using, and pay for the rest on a month-to-month basis.
7. Consider leaving Datadog
Finally, even after all the above work, it may still be worth to consider leaving Datadog. If your Datadog bill is large, it may be worth switching to an open-source alternative. Setting up your own infrastructure for metrics (using tools like Prometheus + Grafana) and logs (using tools like Loki / Kibana) may not be as expensive as you think. Their user experience may be sufficient for your needs. So perhaps it’s good moment for a change?
In our example, after some time, we've decided to switch to our client's existing monitoring stack for some of their services. Although this will require one of our developers to work on it for a month or two, it will save our customers tens of thousands of USD in the following years. Not a bad idea, right?
Last but not least
Perhaps you're considering seeking assistance with front-end, back-end, or mobile development, or finding a competent team to help improve your product while keeping costs low. If this sounds like something you're interested in, feel free to get in touch with us!


